Methodology
This analysis adapts the method of the Institute on Taxation and Economic Policy’s “What the Iran War Costs You at the Pump” — which estimates the extra fuel spending Americans have paid since the start of the Iran war on February 28, 2026 — and extends it from the state and national level down to congressional districts. As of the week ending October 05, 2026, the estimated national total is $105.0 billion, an average of $793 per household.
Nationwide costs vs. expected costs
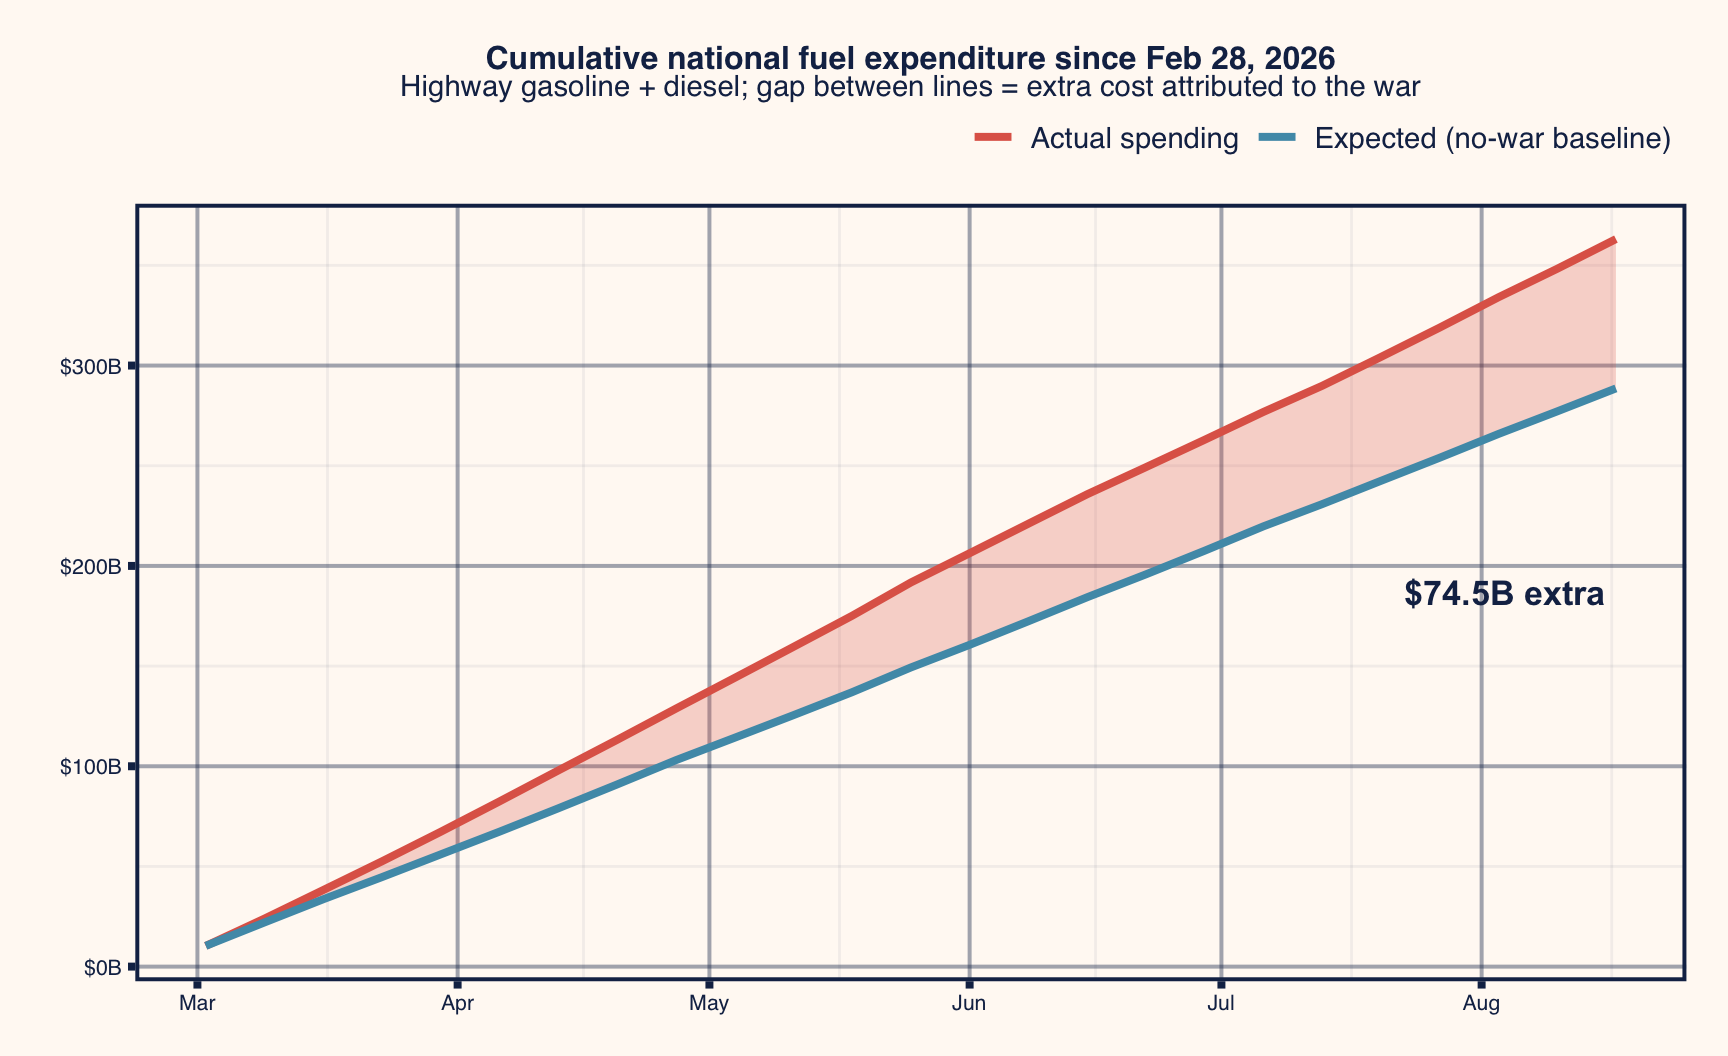
The chart below shows cumulative national spending on highway gasoline and diesel since the war began: what households, businesses, and governments actually paid at observed prices, versus what they would have been expected to pay had prices followed their normal seasonal path from the last pre-war week. The shaded gap between the two lines is the war’s cumulative extra cost.
Validation: placebo backtests
To validate this approach, we ran identical pipeline — same anchor (the last price week before February 28), same seasonal roll-forward, same volumes and state aggregation, over the same 32 weeks — for 2023, 2024, and 2025. The three years for which we had a full set of data to train the model on. Each run trains on its own trailing eleven-year window excluding 2020 (2012–2022 for the 2023 placebo, 2013–2023 for 2024, 2014–2024 for 2025), mirroring the 2015–2025 window behind the 2026 estimate.
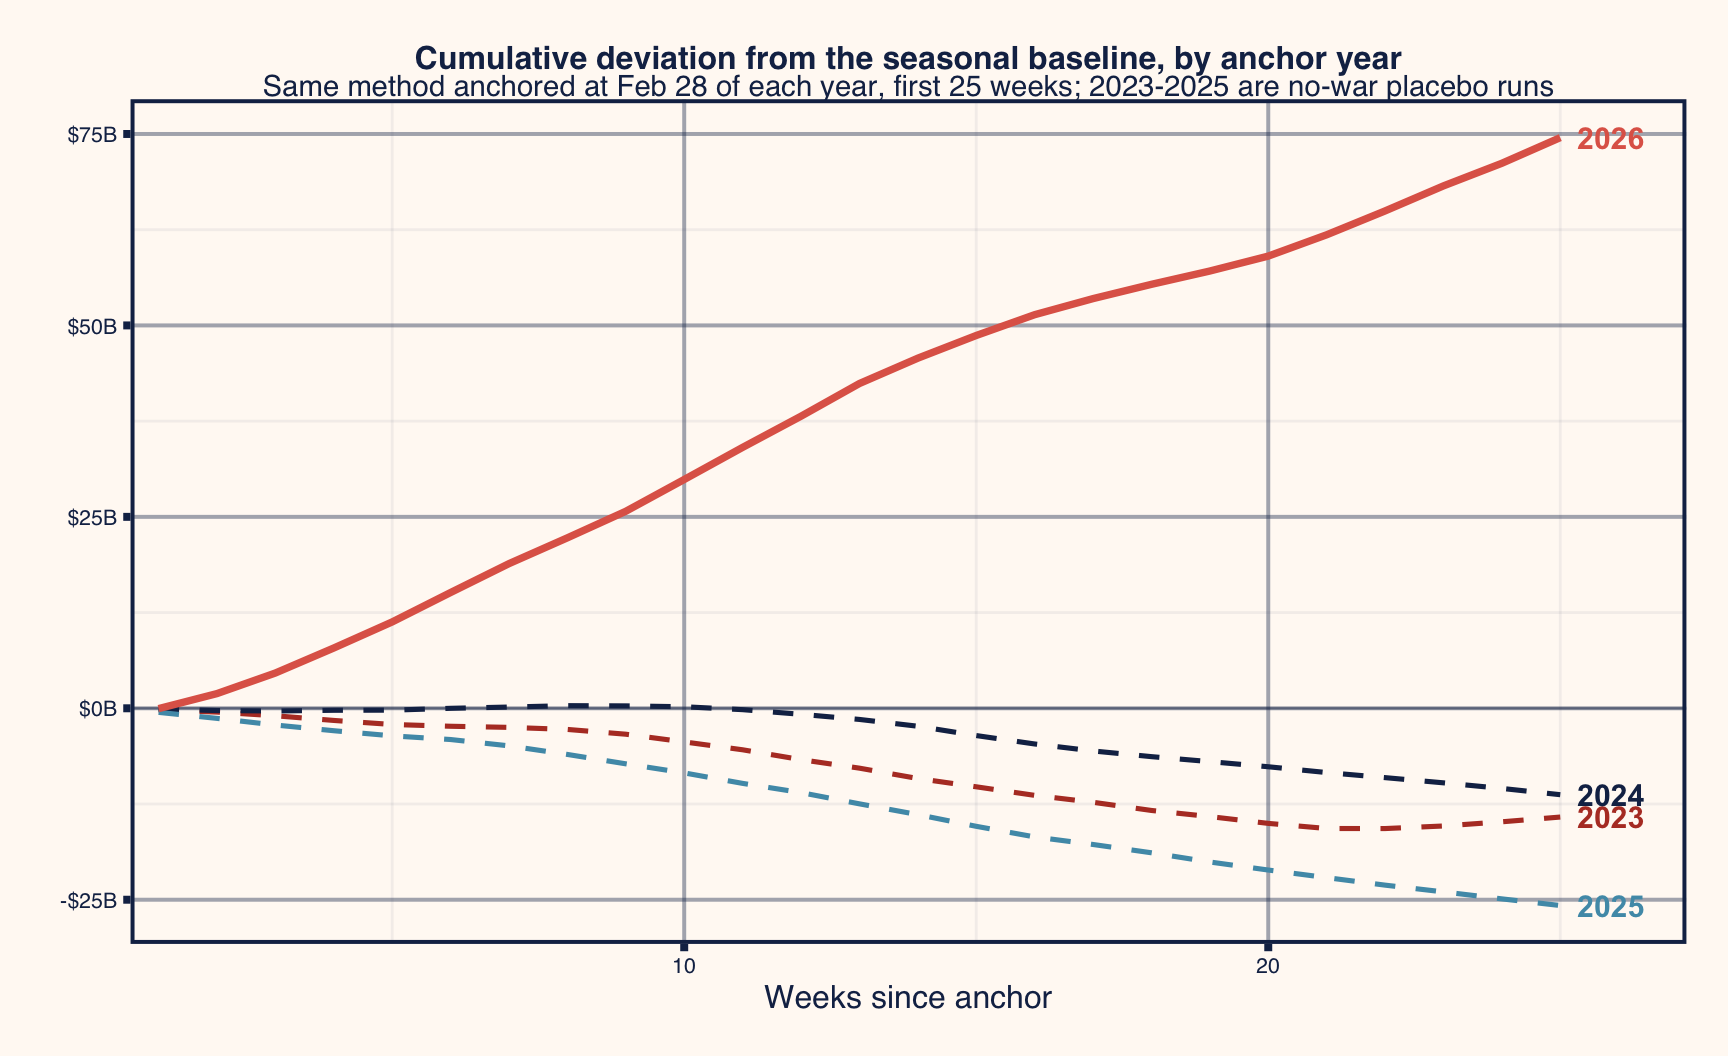
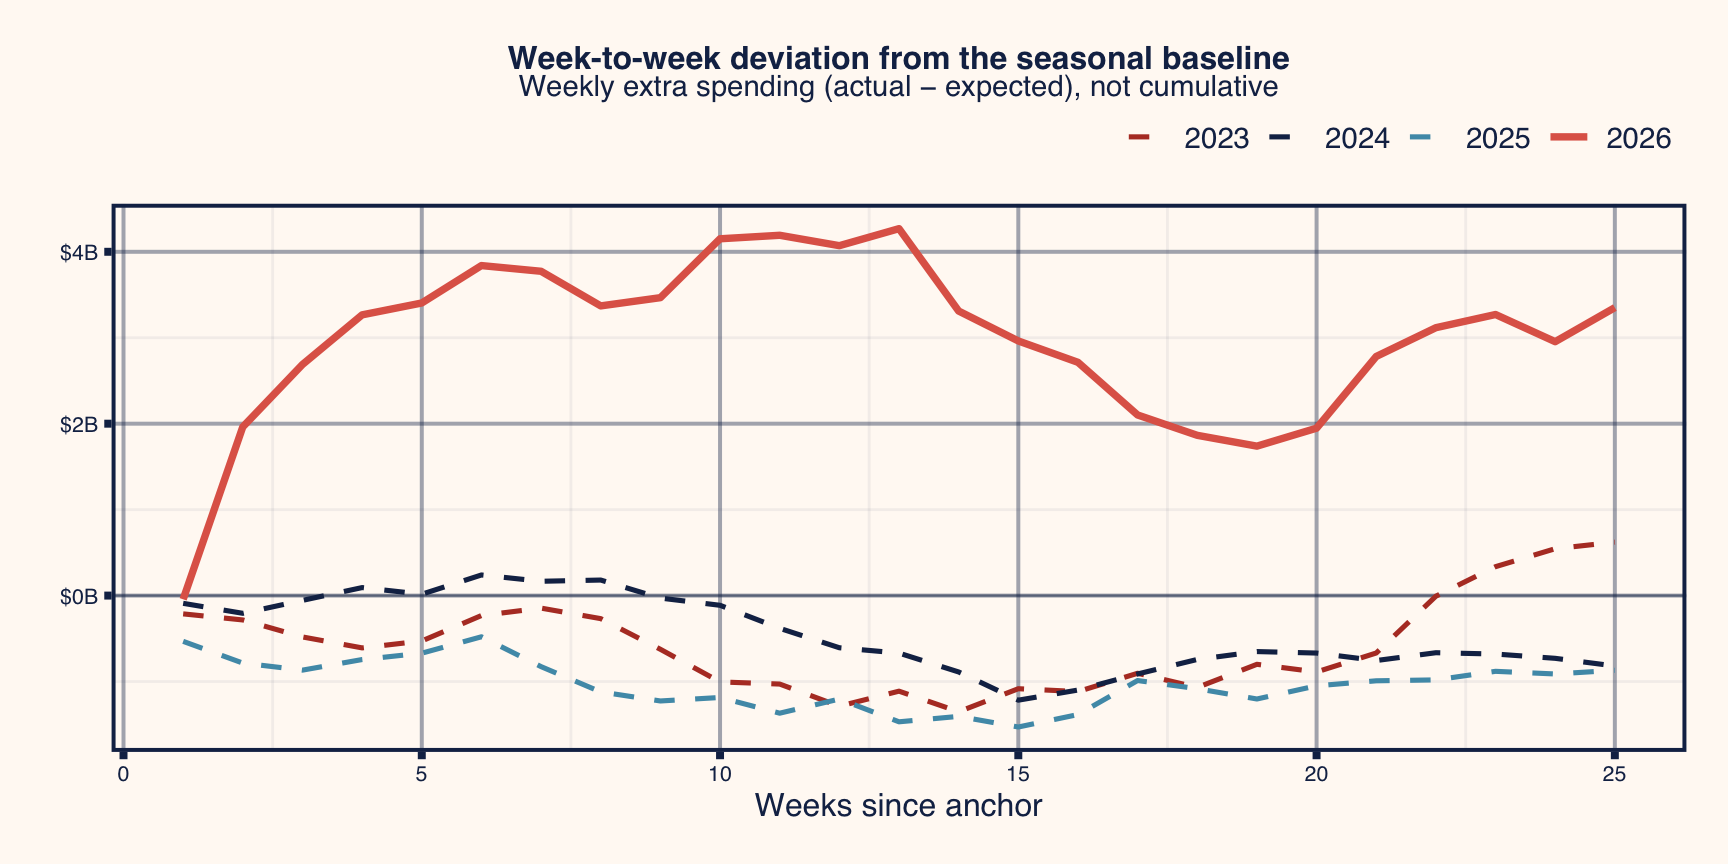
The cumulative curves compound whatever drift the method has; the weekly deviations underneath show the separation is week-by-week, not a few-outlier artifact. The 2026 run averages +$3.3 billion of extra spending per week against placebo means of −$1.0 to −$0.3 billion, and 31 of the 32 war weeks exceed the highest weekly deviation any placebo year produces.
The same weekly deviations as overlaid densities — the placebo years pile up around zero while 2026 sits almost entirely to the right of anything a quiet year generates:
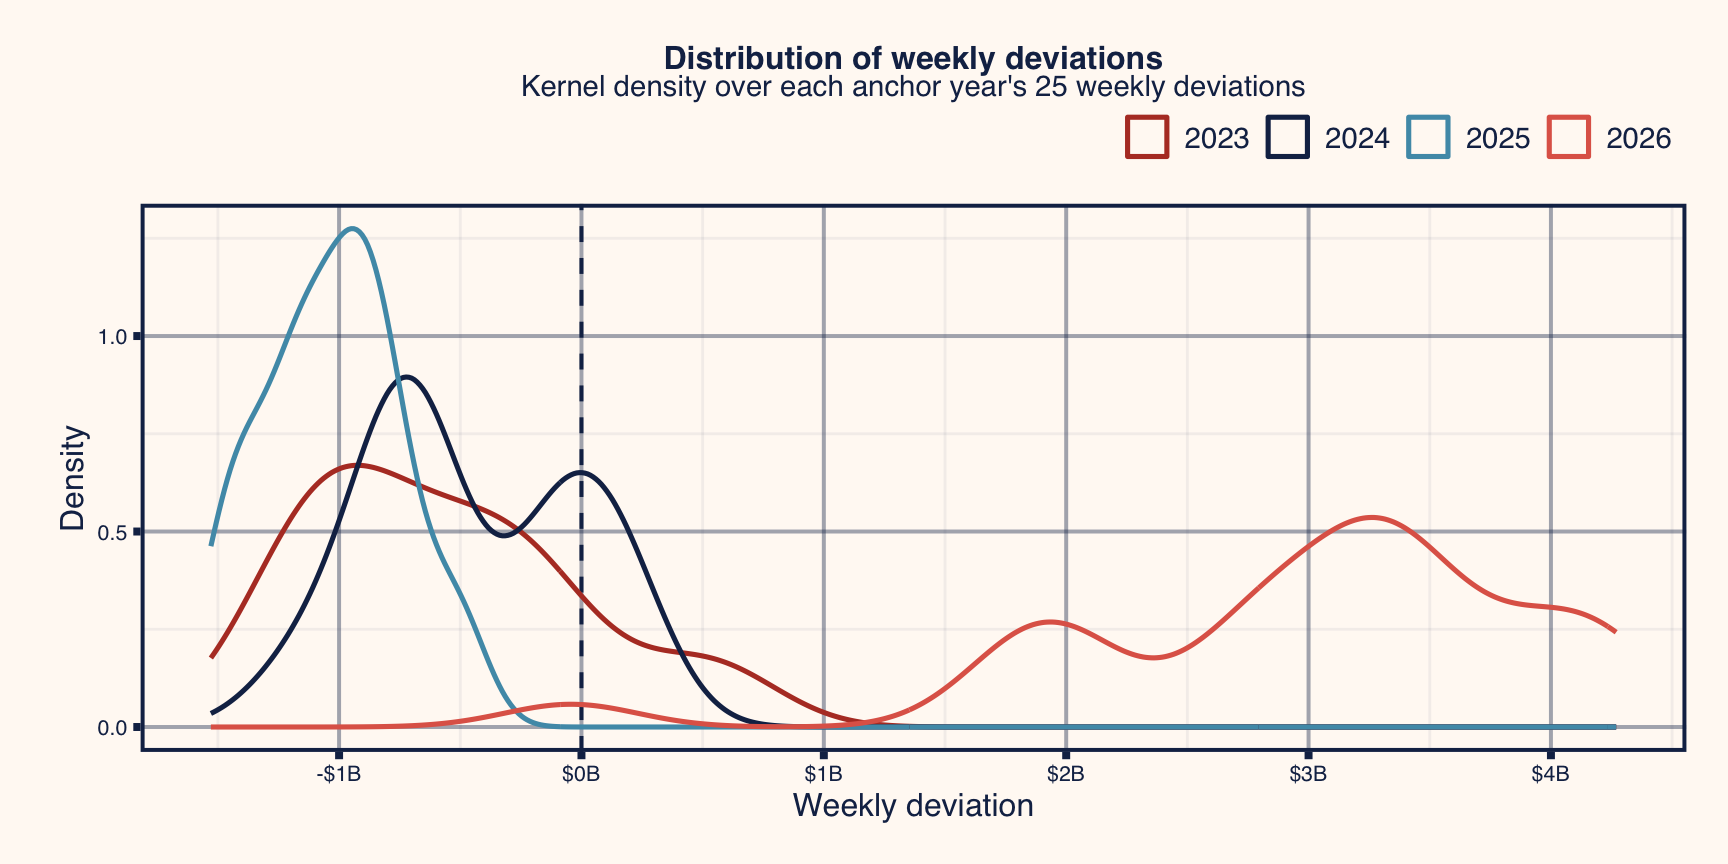
Over 32 weeks the method attributes −$10.1 billion to the 2023 placebo, −$20.6 billion to 2024, and −$31.0 billion to 2025 (about −$77, −$155, and −$234 per household), versus +$105.0 billion in 2026. Two readings:
- Noise floor. In quiet years the method produces deviations of roughly $10–$31 billion over this horizon — the 2026 signal is 3–10× that size and opposite in sign, far outside the placebo range.
- Direction of bias. All three placebos come out negative: the seasonal baseline, whose training decade includes the 2021–22 price surge, tends to over-predict prices in recent calm years. To the extent that bias carries into 2026, the no-war baseline is too high and the $105.0B figure understates the war’s cost rather than overstating it.
Three placebo years are a small sample; they bound the method’s drift, not its full sampling distribution.
Method
- Price gap — EIA weekly retail prices (gasoline: US, 8 PADD sub-regions, 9 states; diesel: US, PADD regions, California, West-Coast-less-CA). The counterfactual takes the last pre-war price (week of 2026-02-23) and rolls it forward by the mean same-calendar-week log price change over 2015–2025, excluding 2020. Gap = actual − counterfactual, in $/gal, weekly.
- Volumes — EIA weekly product supplied (finished motor gasoline, distillate) gives the weekly shape; FHWA Highway Statistics 2024 table MF-21 gives the state distribution and rescales product supplied to highway-use levels (ratios: gasoline 0.94, diesel 0.78).
- State costs — weekly gap × weekly state gallons, summed from 2026-03-02 through the latest EIA week. States without their own price series use their PADD sub-region’s series.
- District allocation — ACS 2024 1-year estimates (119th-Congress districts): state costs are allocated to districts in proportion to aggregate vehicles available (B25046), i.e. per-household cost scales with (district vehicles per household) ÷ (state vehicles per household). District values aggregate back to state totals exactly.
- Maps — Census cartographic boundaries (cb 2024: cd119 districts, states), members and Senate classes from unitedstates/congress-legislators. The Senate layer colors the 33 Class 2 seats plus the two 2026 special elections (Ohio and Florida).
Metrics
- Extra cost per household (headline, map fill): total extra fuel spending — all purchasers, gasoline + diesel — divided across households. Like ITEP’s headline number, this treats business and government fuel costs as ultimately passed through to households.
- Paid directly at the pump: individuals’ gasoline purchases (90% of highway gasoline, ITEP’s assumption).
- Personal diesel: individuals’ diesel (5% of highway diesel; see assumptions).
Reconciliation vs. ITEP (as of 2026-09-17)
| This analysis | ITEP | |
|---|---|---|
| Cumulative national extra spending | $105.0B | $94.5B |
| Average per household | $793 | $706.62 |
Within about 11%; residual differences come from ITEP’s AFDC-derived diesel splits, their forecast component, and week-alignment details.
Assumptions
- Within-state variation is modeled, not measured — no sub-state price or consumption data exists. Vehicles per household is the intensity proxy.
- States without their own EIA price series inherit their PADD sub-region gap.
- Individuals’ share of gasoline: 90% (ITEP’s figure). Individuals’ share of highway diesel: 5% national constant (light-duty share; ITEP derives state-level shares from AFDC registrations — this affects only the personal diesel metric, by at most a few dollars).
- FHWA 2024 state fuel shares are held fixed across the war period.
- DC and territories are excluded; the House map covers the 435 voting districts. Four districts were vacant as of the data pull (TX-23, CA-14, GA-13, FL-20).
- The 2026 Senate race list is the 33 Class 2 seats plus the Ohio and Florida special elections; the specials list is maintained by hand.